| Labfans是一个针对大学生、工程师和科研工作者的技术社区。 | 论坛首页 | 联系我们(Contact Us) |
| Labfans是一个针对大学生、工程师和科研工作者的技术社区。 | 论坛首页 | 联系我们(Contact Us) |
 2019-12-10, 16:49
|
#1 |
|
高级会员
注册日期: 2019-11-21
帖子: 3,025
声望力: 67  |
我有一个包含二维空间中某些点的向量。我希望MATLAB使用从每个点到每个其他点绘制的线来绘制这些点。基本上,我想要一个连接所有顶点的图。你能用情节来做吗,如果可以,怎么做?
回答: 一种解决方案是使用函数MESHGRID为每个点组合创建一组索引。然后,您可以使用函数LINE (在给出的数据的每一列中绘制一行)来绘制每条线: N = 10; %# Number of points x = rand(1,N); %# A set of random x values y = rand(1,N); %# A set of random y values [I,J] = meshgrid(1:N); %# Create all the combinations of indices index = [I(:) J(:)].'; %'# Reshape the indices line(x(index),y(index),'Color','k'); %# Plot the lines hold on plot(x,y,'r*'); %# Plot the points 编辑: 您可能会注意到,上述解决方案将为每个连接绘制一条线,这意味着它将为连接点绘制零长度的连接线,并为每个连接绘制2条线(即,从A点到B点以及从B点到点一种)。这是另一种解决方案(使用功能HANKEL和FIND ),不会绘制多余或不必要的线条: N = 10; %# Number of points x = rand(1,N); %# A set of random x values y = rand(1,N); %# A set of random y values [r,c,v] = find(hankel(2:N)); %# Create unique combinations of indices index = [vc].'; %'# Reshape the indices line(x(index),y(index),'Color','k'); %# Plot the lines hold on plot(x,y,'r*'); %# Plot the points 以上两种解决方案都可以创建视觉上相同的图: 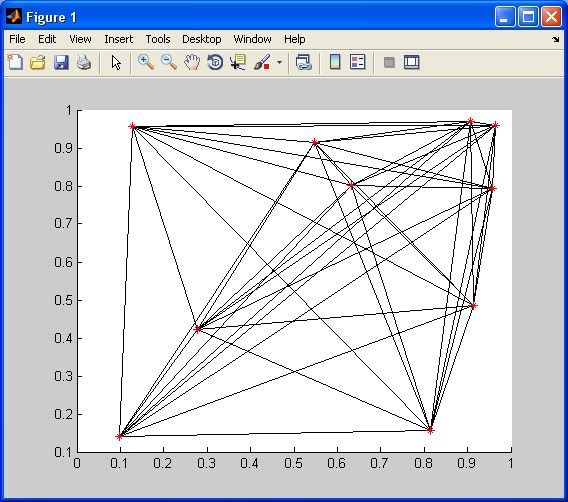 关于时间的说明... 出于好奇,我想我应该选择汉克的解决方案,并将其与Amro的非常简洁的NCHOOSEK解决方案进行比较。对于N = 10 ,没有明显的差异。但是,当我将N增加到更大的值时,我开始看到NCHOOSEK解决方案开始变得非常缓慢:
此语法仅适用于N小于约15的情况。更多&回答... |

|

|


 树形模式
树形模式