| Labfans是一个针对大学生、工程师和科研工作者的技术社区。 | 论坛首页 | 联系我们(Contact Us) |
| Labfans是一个针对大学生、工程师和科研工作者的技术社区。 | 论坛首页 | 联系我们(Contact Us) |
 2024-12-08, 20:21
|
#1 |
|
高级会员
注册日期: 2019-11-21
帖子: 3,025
声望力: 67  |
Matlab release R2018b added the concept of axes-specific toolbars and default axes mouse interactivity.
 Plain 2D plot axes have the following default interactions enabled by default: PanInteraction, ZoomInteraction, DataTipInteraction and RulerPanInteraction. Plain 2D plot axes have the following default interactions enabled by default: PanInteraction, ZoomInteraction, DataTipInteraction and RulerPanInteraction.Unfortunately, I find that while the default interactions set is much more useful than the non-interactive default axes behavior in R2018a and earlier, it could still be improved in two important ways:
function axDefaultCreateFcn(hAxes, ~) try hAxes.Interactions = [zoomInteraction regionZoomInteraction rulerPanInteraction]; hAxes.Toolbar = []; catch % ignore - old Matlab release endendThe purpose of these two axes property changes shall become apparent below. This function can either be called directly (axDefaultCreateFcn(hAxes), or as part of the containing figure’s creation script to ensure than any axes created in this figure has this fix applied: set(hFig,'defaultAxesCreateFcn',@axDefaultCreateFcn);Test setup 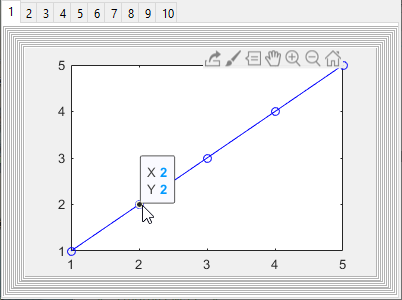 Figure with default axes toolbar and interactivity To test the changes, let’s prepare a figure with 10 tabs, with 10 overlapping panels and a single axes in each tab: Figure with default axes toolbar and interactivity To test the changes, let’s prepare a figure with 10 tabs, with 10 overlapping panels and a single axes in each tab:hFig = figure('Pos',[10,10,400,300]);hTabGroup = uitabgroup(hFig);for iTab = 1 : 10 hTab = uitab(hTabGroup, 'title',num2str(iTab)); hPanel = uipanel(hTab); for iPanel = 1 : 10 hPanel = uipanel(hPanel); end hAxes(iTab) = axes(hPanel); %see MLint note below plot(hAxes(iTab),1:5,'-ob');enddrawnowp.s. – there’s a incorrect MLint (Code Analyzer) warning in line 9 about the call to axes(hPanel) being inefficient in a loop. Apparently, MLint incorrectly parses this function call as a request to make the axes in-focus, rather than as a request to create the axes in the specified hPanel parent container. We can safely ignore this warning. Now let’s create a run-time test script that simulates 2000 mouse movements using java.awt.Robot: ticmonitorPos = get(0,'MonitorPositions');y0 = monitorPos(1,4) - 200;robot = java.awt.Robot;for iEvent = 1 : 2000 robot.mouseMove(150, y0+mod(iEvent,100)); drawnowendtocThis takes ~45 seconds to run on my laptop: ~23ms per mouse movement on average, with noticeable “linger” when the mouse pointer is near the plotted data line. Note that this figure is extremely simplistic – In a real-life program, the mouse events processing lag the mouse movements, making the GUI far more sluggish than the same GUI on R2018a or earlier. In fact, in one of my more complex GUIs, the entire GUI and Matlab itself came to a standstill that required killing the Matlab process, just by moving the mouse for several seconds. Notice that at any time, only a single axes is actually visible in our test setup. The other 9 axes are not visible although their Visible property is 'on'. Despite this, when the mouse moves within the figure, these other axes unnecessarily process the mouse events. Changing the default interactions Let’s modify the axes creation script as I mentioned above, by changing the default interactions (note the highlighted code addition): hFig = figure('Pos',[10,10,400,300]);hTabGroup = uitabgroup(hFig);for iTab = 1 : 10 hTab = uitab(hTabGroup, 'title',num2str(iTab)); hPanel = uipanel(hTab); for iPanel = 1 : 10 hPanel = uipanel(hPanel); end hAxes(iTab) = axes(hPanel); plot(hAxes(iTab),1:5,'-ob'); hAxes(iTab).Interactions = [zoomInteraction regionZoomInteraction rulerPanInteraction];enddrawnowThe test script now takes only 12 seconds to run – 4x faster than the default and yet IMHO with better interactivity (using RegionZoomInteraction). Effects of the axes toolbar The axes-specific toolbar, another innovation of R2018b, does not just have interactivity aspects, which are by themselves much-contested. A much less discussed aspect of the axes toolbar is that it degrades the overall performance of axes. The reason is that the axes toolbar’s transparency, visibility, background color and contents continuously update whenever the mouse moves within the axes area. Since we have set up the default interactivity to a more-usable set above, and since we can replace the axes toolbar with figure-level toolbar controls, we can simply delete the axes-level toolbars for even more-improved performance: hFig = figure('Pos',[10,10,400,300]);hTabGroup = uitabgroup(hFig);for iTab = 1 : 10 hTab = uitab(hTabGroup, 'title',num2str(iTab)); hPanel = uipanel(hTab); for iPanel = 1 : 10 hPanel = uipanel(hPanel); end hAxes(iTab) = axes(hPanel); plot(hAxes(iTab),1:5,'-ob'); hAxes(iTab).Interactions = [zoomInteraction regionZoomInteraction rulerPanInteraction]; hAxes(iTab).Toolbar = [];enddrawnowThis brings the test script’s run-time down to 6 seconds – 7x faster than the default run-time. At ~3ms per mouse event, the GUI is now as performant and snippy as in R2018a, even with the new interactive mouse actions of R2018b active. Conclusions MathWorks definitely did not intend for this slow-down aspect, but it is an unfortunate by-product of the choice to auto-enable DataTipInteraction and of its sub-optimal implementation. Perhaps this side-effect was never noticed by MathWorks because the testing scripts probably had only a few axes in a very simple figure – in such a case the performance lags are very small and might have slipped under the radar. But I assume that many real-life complex GUIs will display significant lags in R2018b and newer Matlab releases, compared to R2018a and earlier releases. I assume that such users will be surprised/dismayed to discover that in R2018b their GUI not only interacts differently but also runs slower, although the program code has not changed. One of the common claims that I often hear against using undocumented Matlab features is that the program might break in some future Matlab release that would not support some of these features. But users certainly do not expect that their programs might break in new Matlab releases when they only use documented features, as in this case. IMHO, this case (and others over the years) demonstrates that using undocumented features is usually not much riskier than using the standard documented features with regards to future compatibility, making the risk/reward ratio more favorable. In fact, of the ~400 posts that I have published in the past decade (this blog is already 10 years old, time flies…), very few tips no longer work in the latest Matlab release. When such forward compatibility issues do arise, whether with fully-documented or undocumented features, we can often find workarounds as I have shown above. If your Matlab program could use a performance boost, I would be happy to assist making your program faster and more responsive. Don’t hesitate to reach out to me for a consulting quote. The post Improving graphics interactivity appeared first on Undocumented Matlab. Related posts:
More... |

|

|


 平板模式
平板模式

